Insurevision AI
Build a B2B platform and mobile application for Fleet management.
Insurevision AI
Build a B2B platform and mobile application for Fleet management.
Insurevision AI
Build a B2B platform and mobile application for Fleet management.
Project Overview
InsureVision is a London-based AI startup focused on transforming road safety and vehicle risk assessment using advanced visual Transformer AI models.
This project was an early-stage B2B tool designed for fleet management.
I was brought in as the UX/UI designer to help the team align on product goals, translate ideas into digital products.
InsureVision is a London-based AI startup focused on transforming road safety and vehicle risk assessment using advanced visual Transformer AI models.
This project was an early-stage B2B tool designed for fleet management.
I was brought in as the UX/UI designer to help the team align on product goals, translate ideas into digital products.
My contribution
Built the platform & mobile from scratch through close collaboration and iterative design
Improved task flow clarity and user experience based on testing feedback
Led workshops to align stakeholders and define key user journeys
Created scalable design system and UX/UI design to support future product growth
Built the platform & mobile from scratch through close collaboration and iterative design
Improved task flow clarity and user experience based on testing feedback
Led workshops to align stakeholders and define key user journeys
Created scalable design system and UX/UI design to support future product growth
Given the turnaround, I conducted a small survey study with 15 people. Most of these individuals are testers and developers. I designed the first draft and Low-fid to define the visual style and information architecture.
Align with the team
The team had several product ideas but lacked a clear shared understanding of the core user needs and product value.
My first step was to facilitate alignment through a structured workshop.

UX Workshop
Given the turnaround, I conducted a small survey study with 15 people. Most of these individuals are testers and developers. I designed the first draft and Low-fid to define the visual style and information architecture.
UX Workshop
To address this, I planned and facilitated a collaborative workshop to define the product focus and ensure cross-functional alignment.
Priority Matrix Map
During the workshop, key team members shared their opinions about the priority of the features they need.
To address this, I planned and facilitated a collaborative workshop to define the product focus and ensure cross-functional alignment.
UX Workshop
To address this, I planned and facilitated a collaborative workshop to define the product focus and ensure cross-functional alignment.
Priority Matrix Map
During the workshop, key team members shared their opinions about the priority of the features they need.
To address this, I planned and facilitated a collaborative workshop to define the product focus and ensure cross-functional alignment.
Workshop goals: Align on a unified vision, define the MVP scope, and prioritize key features
Methods used: Whiteboarding sessions, use case mapping, and competitive analysis
Outcome: A shared understanding of the user journey and a clearly prioritized feature roadmap
Given the turnaround, I conducted a small survey study with 15 people. Most of these individuals are testers and developers. I designed the first draft and Low-fid to define the visual style and information architecture.
Main user groups
Fleet manager: The main purpose of a fleet manager is to review drivers' performance, analysis drivers' data.
Insurance Underwriter: User-based on fleet risk to check the trend of fleet management and check the event.


User flow

Information Architecture and design features

Dashboard: To view the overall safety score and trend.
Driver performance: can track drivers' performance, with information about events, coaching history, and score change over time.
Event: Provides a video about the latest events and shows the risk.
Design solution

Dashboard
Dashboard


Given the turnaround, I conducted a small survey study with 15 people. Most of these individuals are testers and developers. I designed the first draft and Low-fid to define the visual style and information architecture.
Driver Profile
Driver Performance allows you to track a driver's behavior and event history, as well as review related videos.


Given the turnaround, I conducted a small survey study with 15 people. Most of these individuals are testers and developers. I designed the first draft and Low-fid to define the visual style and information architecture.
Event
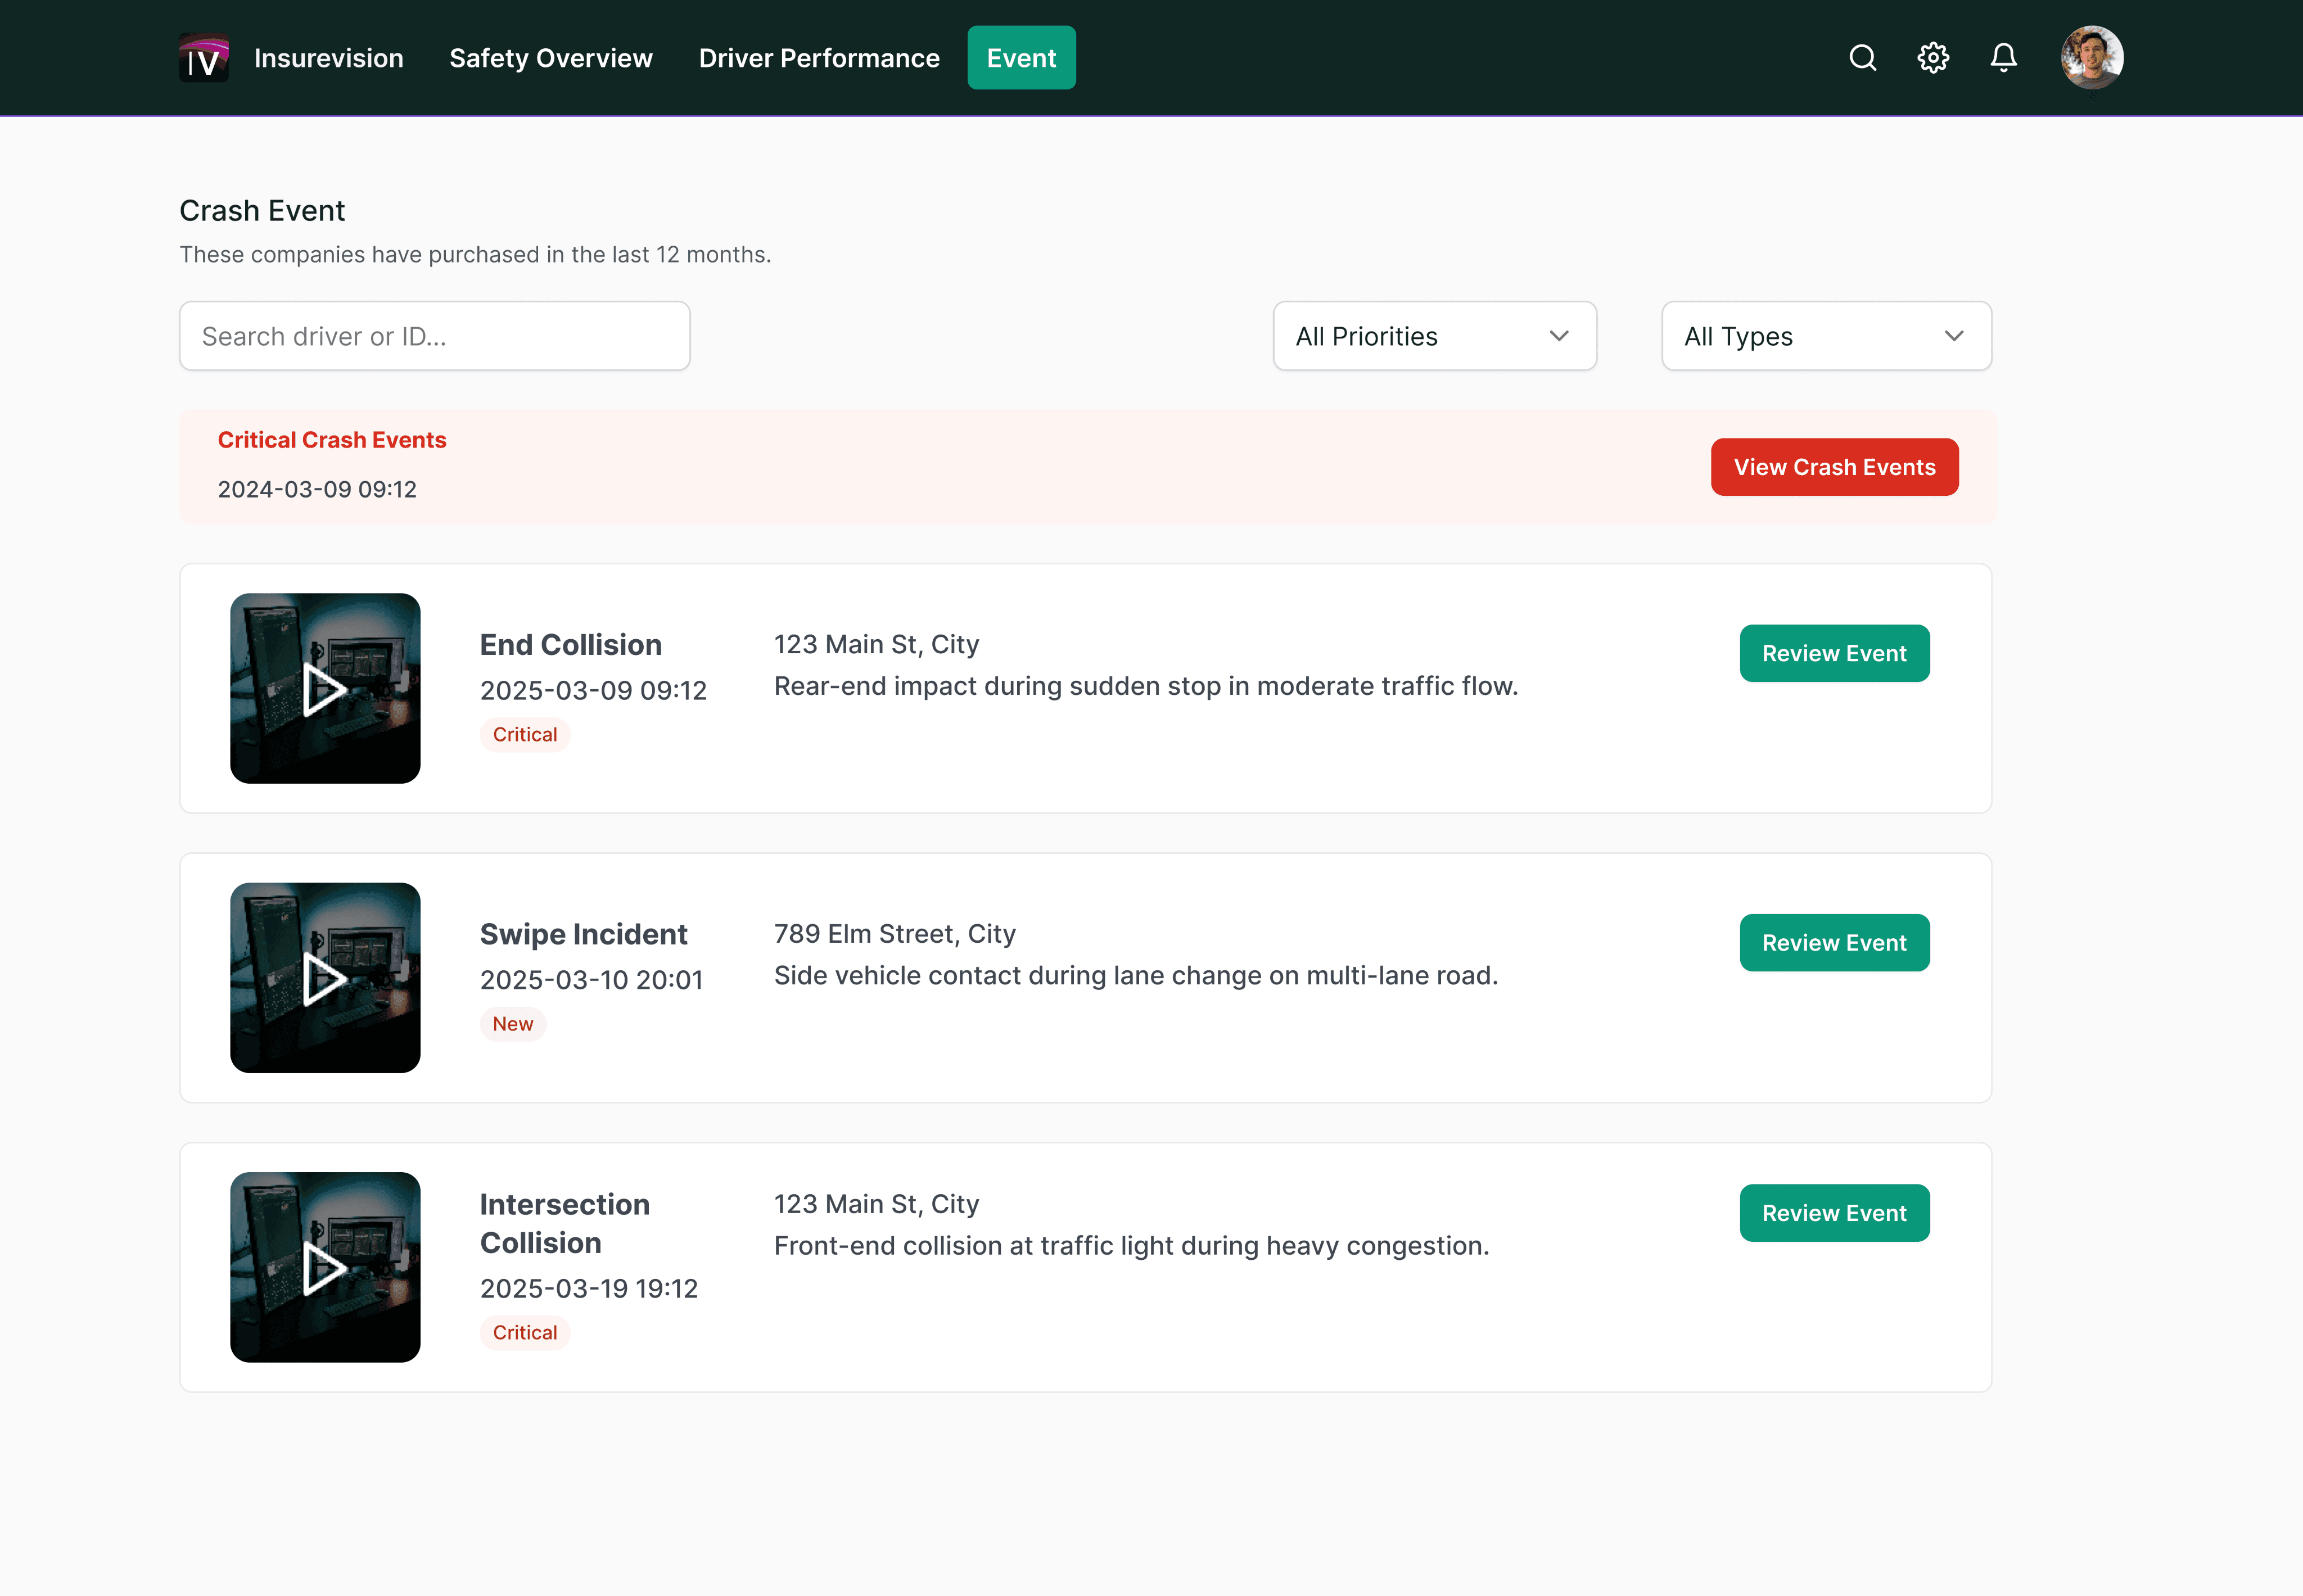
The Event section is essential for both fleet managers and insurance users, helping them track incidents more efficiently and take quick action based on event priority.

Given the turnaround, I conducted a small survey study with 15 people. Most of these individuals are testers and developers. I designed the first draft and Low-fid to define the visual style and information architecture.
Usability tests
Before handing off the design deliverables to the dev team, we performed more than 10 useability tests to validate out design decision.

Given the turnaround, I conducted a small survey study with 15 people. Most of these individuals are testers and developers. I designed the first draft and Low-fid to define the visual style and information architecture.
Overview of driver’s performance
Problem: Lacked an overview of fleet drivers
Solution: Add a quick overview of all driver scores

Given the turnaround, I conducted a small survey study with 15 people. Most of these individuals are testers and developers. I designed the first draft and Low-fid to define the visual style and information architecture.
Driver's profile
Problem: too much data, which overwhelms users
Solution: separated the Overview and Statistic Score into two tabs

Given the turnaround, I conducted a small survey study with 15 people. Most of these individuals are testers and developers. I designed the first draft and Low-fid to define the visual style and information architecture.
Mobile application for drivers experience
A platform built by fleet managers and insurance underwriters to evaluate driver performance and improve road safety through coaching.
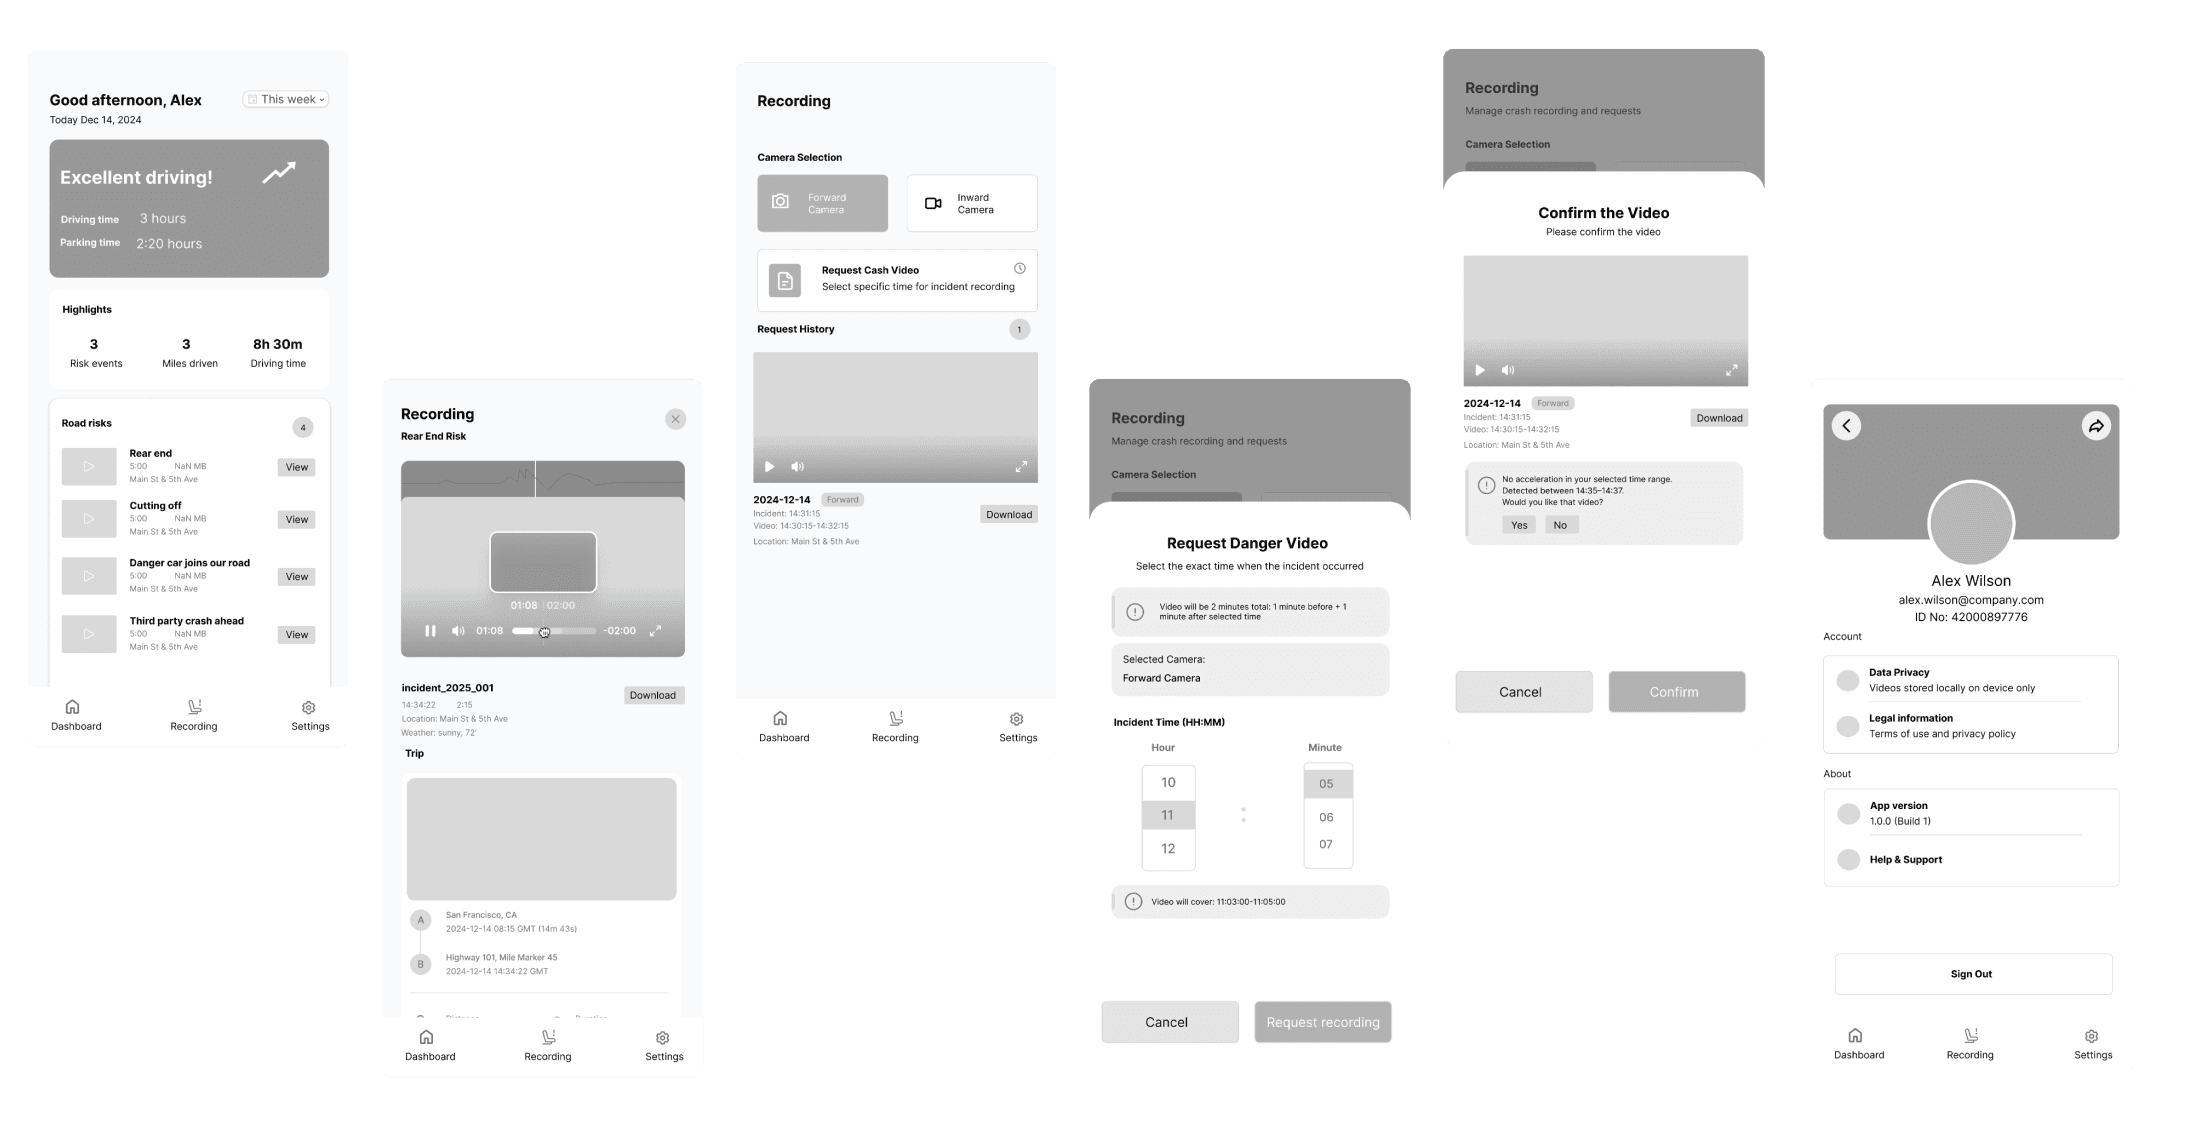
For drivers, we also designed a mobile application that allows them to review their driving records — including speed and safety scores — and access video footage in case of an accident.

Given the turnaround, I conducted a small survey study with 15 people. Most of these individuals are testers and developers. I designed the first draft and Low-fid to define the visual style and information architecture.
Lowfi mockups
The quick paper sketches helped me swiftly eliminate impractical ideas and served as a reference for creating low-fidelity digital mockups.

Given the turnaround, I conducted a small survey study with 15 people. Most of these individuals are testers and developers. I designed the first draft and Low-fid to define the visual style and information architecture.
Hifi designs working with design systems and across teams
Based on the design system, I generated high-fidelity mockups that align with the company’s established design language.
Impact & Takeaway
I helped build the platform and mobile application from the ground up. I worked on early workshops, defined the user flow, and improved the design through several rounds of feedback.
Impact & Takeaway
I helped build the platform MVP from the ground up. I worked on early workshops, defined the user flow, and improved the design through several rounds of feedback.
Impact & Takeaway
I helped build the platform and mobile application from the ground up.
I worked on early workshops, defined the user flow, and improved the design through several rounds of feedback.